“Disappointment is the gap that exists between expectations and reality.”
Have you ever heard this one?
It might seem negative to you, or at best, you could claim that it most certainly does not seem upbeat.
But just because something isn’t upbeat doesn’t make it incorrect or inappropriate.
In the current Toronto real estate market, the largest disappointments experienced can all be drawn back to one common theme: expectations.
Those expectations, however, can be rooted in a fair number of themes: naivety, ignorance, and a lack of education would top the list. I would offer that greed and foolishness follow not too far behind.
This isn’t to say that there aren’t any market participants with reasonable expectations out there at the moment, nor am I saying that I haven’t heard a slew of happy stories, involving both buyers and sellers.
But we’re in the midst of a year with the lowest number of property sales in history.
Tell me that my glass is “half empty,” but I’m trying to portray an accurate picture of the market, convey stories that represent the majority, and hit the topics that are the most important. And out there in the market right now, that means discussing the wild expectations that real estate market participants have.
In my podcast last week, I talked about the four parties to the real estate transaction:
-Buyer
-Seller
-Listing Agent
-Buyer’s Agent
In our current market, it takes not just a concerted effort on behalf of all four parties to get a deal done, but experience, intelligence, commitment, and concessions.
The moment that one of the four parties develops an ego, the transaction is lost.
More transactions are being lost out there right now because of ego than ever before, and I think there’s a very strong relationship between ego and expectations.
Expectations, as I mentioned, are rooted in many things, including a lack of education.
There is a sort of “wilful” ignorance out there as well, which isn’t so much a seller saying, “I don’t give a damn,” but rather a seller really, truly not understanding the market, or having a listing agent who can explain it to them.
Looking over the October TRREB statistics, there’s an argument to be made that these are “good.”
An agent on my team made an offer on a condo this week and the listing agent, who was completely out of his depth, told her, “The average 416 condo price was up last month. The market is strong!”
You might suggest that he was simply negotiating, but as the process went along, it was clear that he simply couldn’t look at the calendar and identify that it was November of 2025.
This is very common out there right now, but perhaps the unreasonable expectations in the market are, at least in part, due to an inability to understand the data.
Case in point, a comment that I overheard in our office this week:
“Did you see the October stats? The average home price barely moved! People are saying it’s a tough market out there, but it’s not like the home price dropped.”
The statistic in this comment might be correct, but the inference and conclusion are not.
Here’s an updated look at the GTA average home price:
It’s true: the average home price in October barely moved.
Five grand.
Hardly anything to get excited about!
If I were trying to put an optimistic spin on things, I would echo the comment that I overheard in my office, and suggest that the average home price is “holding strong.”
But as I do every month, I look for historical trends to see how current market movements stack up against historical movements during the same time period.
The fall market typically ascends. I would expect (there’s that word again…) that the average home price shoudl increase in the month of October, as evidenced by the last two decades’ worth of data:
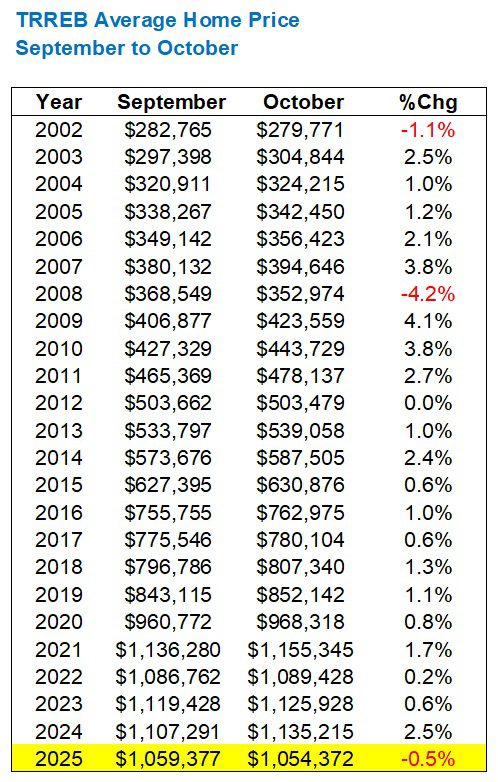
Alas, it’s been seventeen years since we saw the October average home price trail September.
The average movement from 2002 through 2024 is only +1.3%, which, again, isn’t all that significant.
But it’s the trend that draws my attention. The trend says that, since 2008, we have not seen a year when prices decline from September to October, and suddenly, that trend has been reversed.
Only time will tell whether this represents an “outlier” or whether it is, in fact, an “inflection point.”
But the next chart offers more of the same:

Our monthly look at the year-over-year average home price shows that the decline ramped up in summer and came back down (to 4.3%) in September.
But since prices declined from September to October for the first time since 2008, the year-over-year figure for October is going to surge.
And it has!
All the way to 7.1%, which is a new high for 2025.
Nowhere is this better illustrated than in the following chart.
Note that the “gap” between 2024 and 2025 remained essentially the same from April through September, but the trend reversed in October, thereby widening that gap:

The average home price did decline from October to November in 2024, so whether this gap continues to widen in 2025 depends on the relative movement next month.
The biggest story of 2025, in my opinion, has been with respect to sales, or the lack thereof.
In September, the sales total was the fourth-lowest in any month of September, all-time.
That trend continued last month:

But we did see an increase in sales, month-over-month, from September to October.
This is very important in the context of a conversation about “market outliers.”
Consider the following:

With sales increasing from September to October, seventeen times in the previous twenty-three years, it’s a “good” sign for the market that the trend wasn’t reversed, as we saw with respect to price in the previous section.
However, throughout 2025, I’ve been clamouring about how we will see not just a new record low for sales, but rather a new record that annihilates the old one.
With a record low of 66,315 sales in 2023, leading to a modest improvement of 67,984 in 2024, there’s no denying that we’re on pace for said obliteration:

I don’t think anybody is receiving a point for their sales prediction in our 2025 TRB Real Estate Prediction Game.
New listings in the GTA followed suit from September, checking in at number-two all-time on the list:

As we noted in this space last month, the inventory numbers were very inflated in the fall of 2020 due to the pandemic, which pushed the usual spring market activity into the fall.
Also following suit from September was the “absorption rate” or ratio of sales to new listings, which checked in at the third-lowest all time for the month:
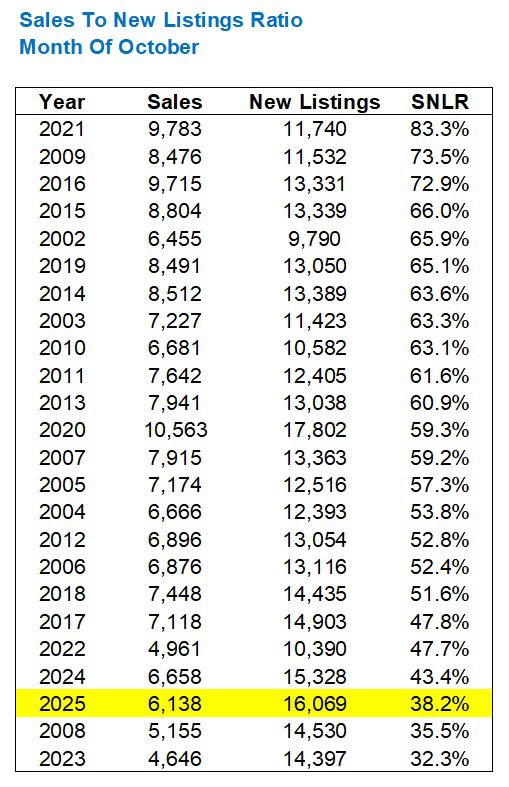
Consider that the average absorption rate in October from 2002 through 2024 was 57.9%.
That should put last month’s 38.2% in perspective.
Now, if you really wanted to create a bullish argument, as many listings agents are doing, you would use the following chart:

Go ahead; create a bullish argument from this data.
“The absorption rate is at the high-point for 2025!”
“The market hasn’t been this tight all year!”
“Months of inventory are shrinking!”
Perspective. Expectations. It’s all relative.
If you want to see the entire data set for the last five years to draw your own conclusions, here you go, eat your heart out:

While the absorption rate in September of 2025 was higher than that of 2023 and 2024, note that the increase in absorption rate from September to Ocotber in 2024 was 15.8% and last month it was a mere 9.2%.
This means that the market isn’t quite moving as we’re accustomed to this fall.
Typically, sales increase, inventory decreases, the market tightens, and prices rise, on average.
Sales did increase.
Inventory did decline.
The market did tighten.
But prices did not rise.
I would offer that sales didn’t increase enough, inventory didn’t decline enough, and the market didn’t tighten enough, which all told, resulted in a decline in the average home price of 0.5%.
One final point on the absorption rate, if I may: the gap between 2025 and the prior four years is shrinking:

Last, but not least, we had 27,808 active listings last month, which is simply the number of properties listed on October 31st.
This is down from September; however, this figure now ranks fifth on the all-time list of months of inventory – and not just in September. I mean ever:

Depending on your perspective, your place in the market, and your ability to “see what you want to see,” you could choose any stat from the preceding blog post to create your argument, whether good, bad, or ugly.
But with the Bank of Canada cutting the lending rate to 2.25% last month, and another twenty-five basis points on the way, I have to wonder how long buyers will remain on the sidelines…